SAR Vessel Density Tracking in the Strait of Hormuz
Monitor oil tanker and cargo ship concentrations in C-band SAR imagery with meter-level precision. Klarety agents detect vessel signatures, quantify clustering across transit corridors, and flag congestion buildup in real time. One prompt delivers a complete shipping density intelligence report — no GIS experience, no ArcGIS license, no coding.
Try SAR analysis freeSAR intelligence for maritime shipping analysts
Satellite-backed maritime intelligence
AI agents query Sentinel-1 SAR and return analyst-grade vessel density reports from a single prompt.
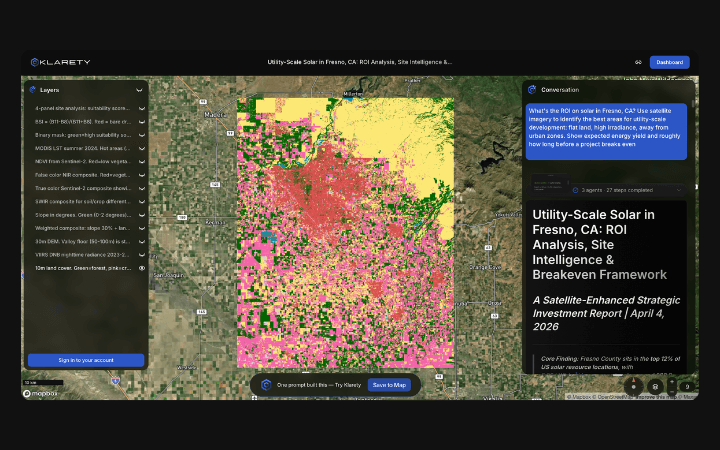
C-band vessel signature detection
Agents compute VV backscatter to classify vessel size and flag clustering anomalies across Hormuz transit corridors.
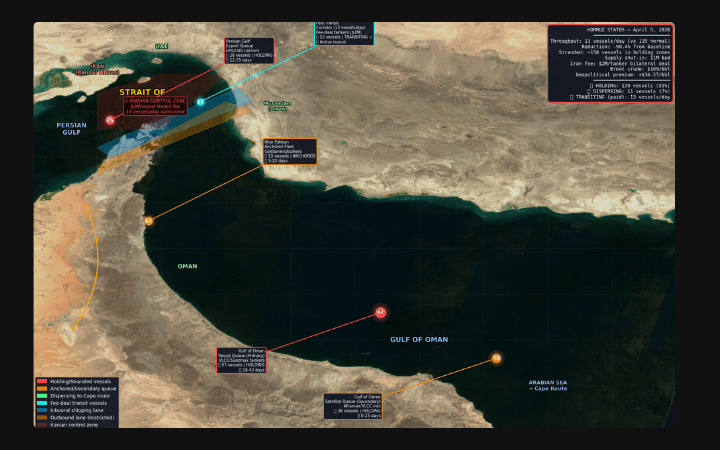
Density layers for maritime GIS pipelines
Export vessel density GeoJSON for overlay with AIS route data in QGIS, PostGIS, or GEE.
How Klarety tracks vessel density in Hormuz
Klarety agents pull Sentinel-1 GRD scenes over the Hormuz AOI, compute VV backscatter vessel detection, and cluster vessels into density grids at 500m resolution. The output is a structured JSON density report with vessel count, size classification, and congestion severity per corridor — delivered in minutes from one prompt. Try it at klarety.ai.
Klarety AIRun Hormuz vessel density analysis