Data Center Construction Progress from Satellite
Monitor hyperscaler buildouts without site access. Klarety analyzes Sentinel-2 multispectral imagery to detect building footprints, shadow-derived height estimates, and material stockpile changes quarter-over-quarter. Agents classify construction phase automatically. One prompt returns a phased progress report — no GIS license, no site visit.
Track capacity expansionConstruction phase intelligence for real estate investors
Phase reports without site visits or GIS setup
Klarety agents run shadow photogrammetry on Sentinel-2 time-series and return phased progress reports with height estimates.
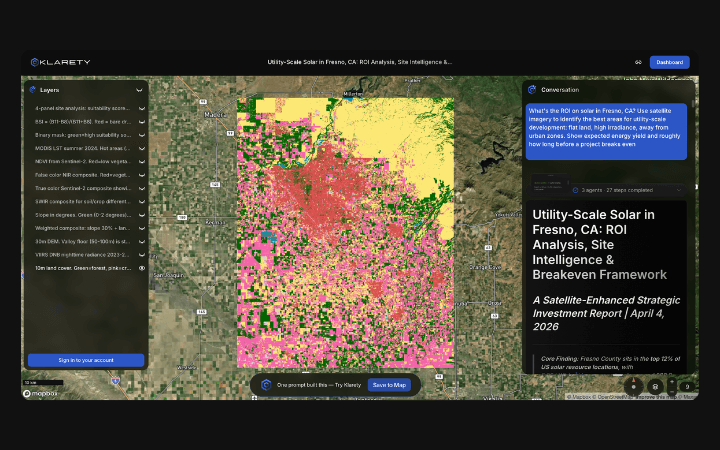
Shadow-length height and footprint change detection
Agents compute solar geometry-corrected shadow vectors to estimate building height and detect frame and fit-out phase transitions.
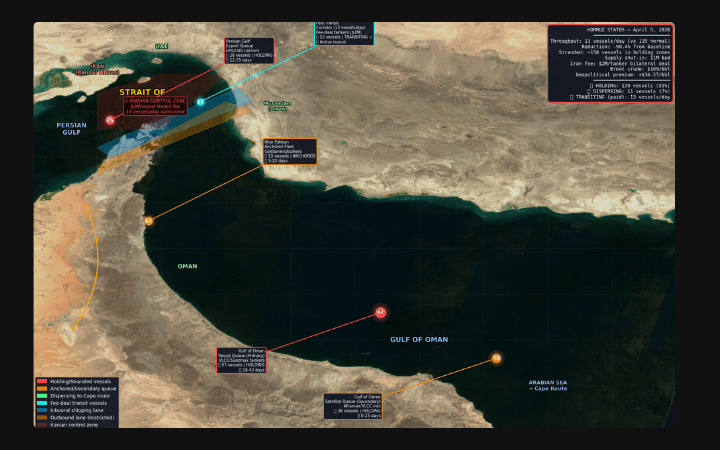
Construction layers for real estate portfolio GIS
Export building footprint polygons and height rasters for real estate asset monitoring and capital deployment model integration.
Shadow photogrammetry for data center height tracking
Klarety agents use solar geometry at image acquisition time to compute shadow-length-derived building height estimates from Sentinel-2 at 10m resolution. Footprint area is measured quarterly from SWIR-enhanced building masks. Phase is classified: foundation (no shadow), structural (shadow <10m), fit-out (shadow stable, SWIR low). Output is a height time-series and phase classification table.
Klarety AITrack construction progress at your site