Vessel Transit Recovery After Shipping Disruptions
Measure how quickly global shipping lanes return to normal after closures or conflicts. Klarety agents combine SAR vessel counts at choke points with known route baselines to compute recovery velocity, throughput recovery rate, and estimated normalization date. Shippers and insurers receive daily progress reports.
Monitor recoveryShipping recovery metrics from daily SAR vessel counts

Recovery timeline forecasts from satellite data
Klarety agents compute throughput recovery rates against pre-disruption baselines and return normalization timeline estimates.
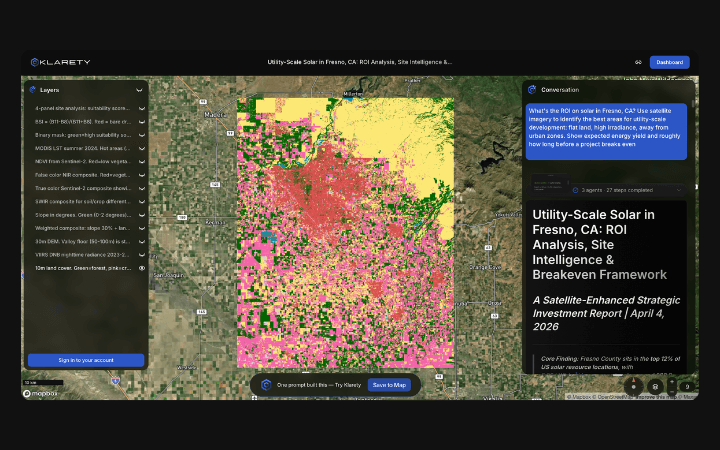
Daily choke-point vessel counting and recovery curves
Agents run daily Sentinel-1 passes over key straits and compute rolling vessel count recovery curves against historical baselines.
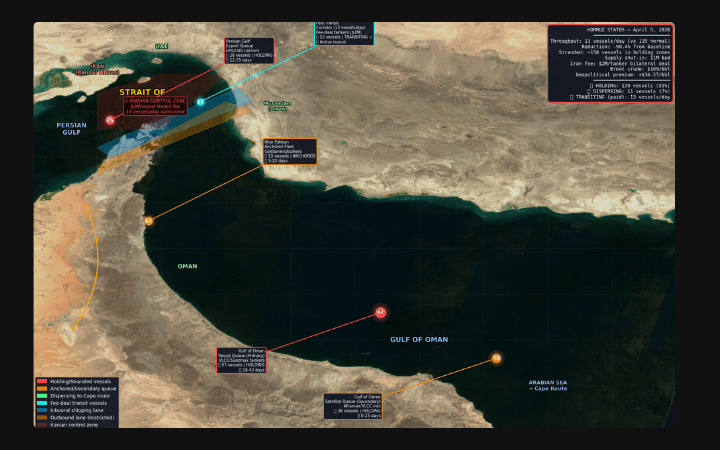
Recovery data for logistics GIS dashboards
Export daily throughput metrics and recovery trajectory data for supply chain visibility platform integration.
SAR recovery curve modeling for disrupted shipping lanes
Klarety agents compute weekly SAR vessel counts at disrupted choke points, fit a sigmoid recovery curve to the post-disruption time series, and estimate the date at which throughput returns to 90% of baseline. Output is a recovery curve chart, weekly throughput table, and normalization date estimate with confidence interval.
Klarety AITrack shipping recovery in your route